• App

    Android Auto — what we learnt from drivers

    Before we started working on NaviExpert for Android Auto, we wanted to find out what works in existing sat-nav apps and what frustrates drivers. We began by looking at other products, and then tested our own interface before rolling it out.

    My role

    I recruited drivers, organised meetings, prepared questionnaires and conducted interviews. I worked alongside the product owner, who took notes during the sessions and was responsible for the interface design. Together, we analysed the results.

    On the road

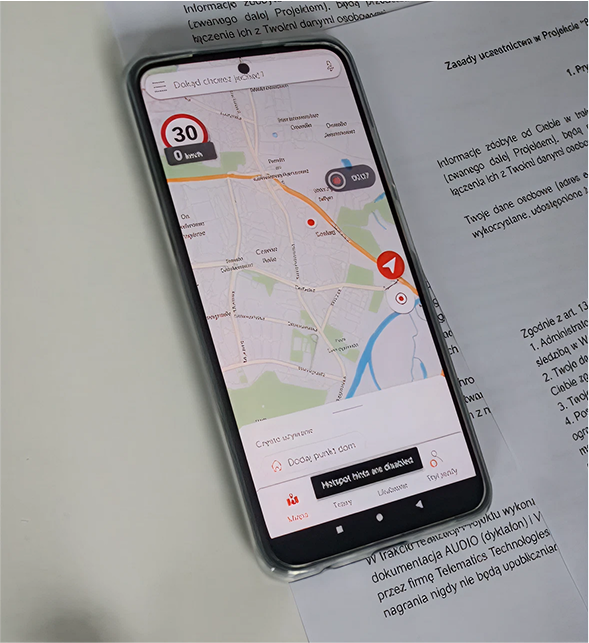
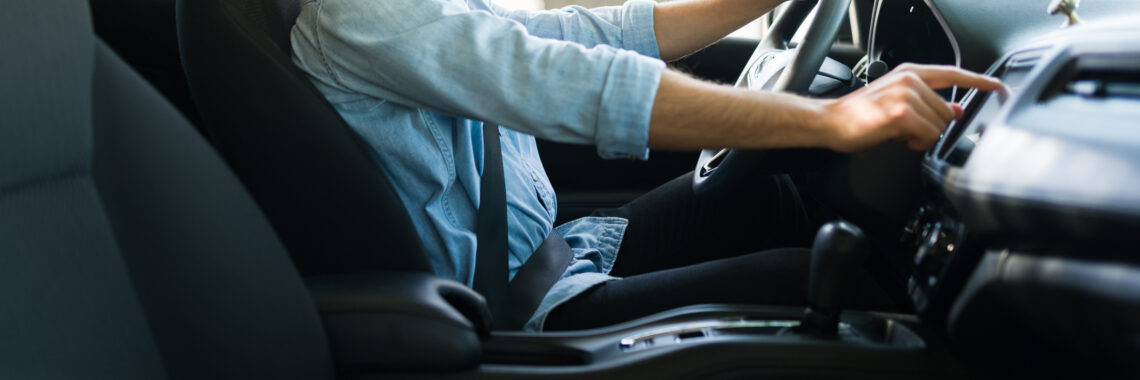
    We travelled with drivers to see how they used Android Auto in practice. In the apps being tested at the time, maps would sometimes load slowly or freeze, voice search didn’t always work, and some basic functions were difficult to find.

    One problem stood out in particular: using the car’s screen didn’t always mean you could put your phone away. Searching for a petrol station or accessing your favourite places sometimes required you to pick it up again.

    There were also issues with the interface itself. Bright colours were distracting, large panels obscured the map, and drivers couldn’t always pan or zoom as they’d expect.

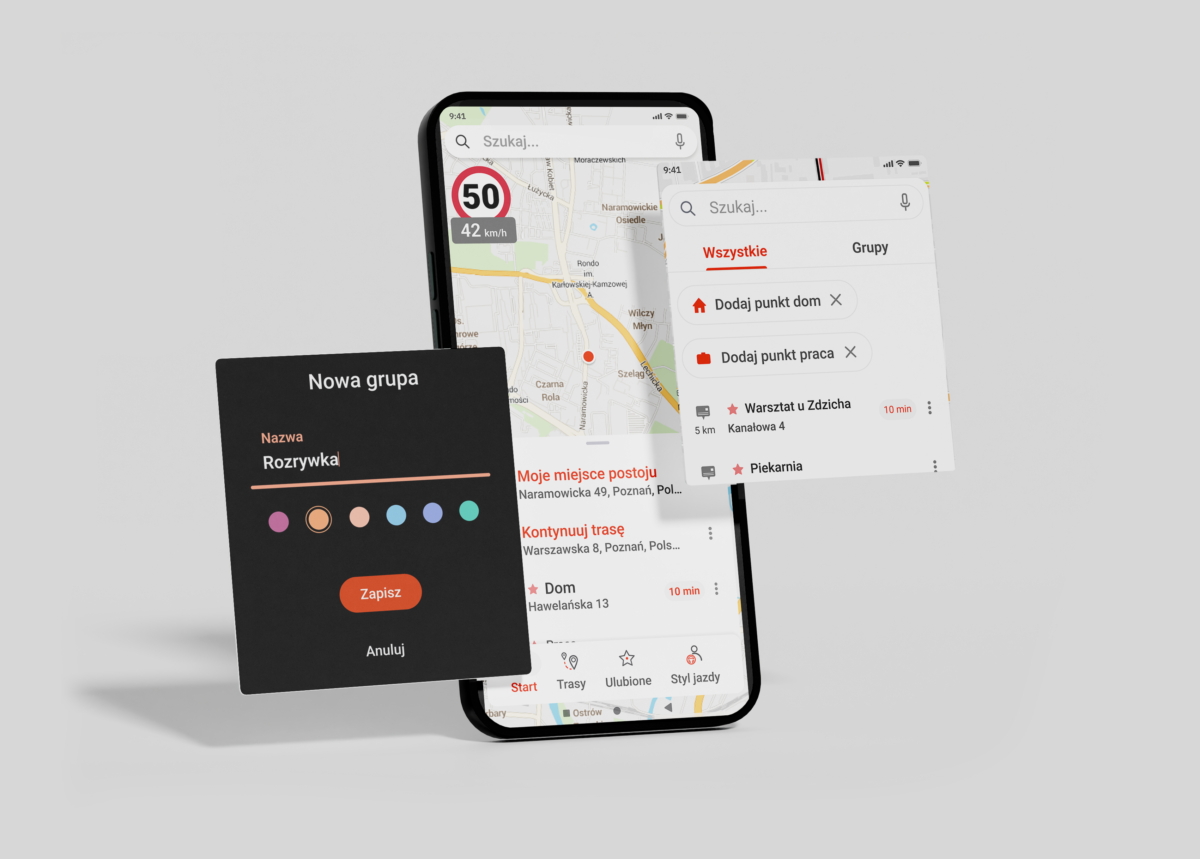
    These findings helped set the direction for our solution: sound controls directly on the main screen, a clear mute status, muted colours and a non-glare night mode. Voice search was also a priority for the product owner.

    Testing our interface

    Once the product owner had prepared the design, we travelled to Warsaw to test it with six users. We used a prototype on a tablet, observing how participants found features and carried out typical tasks.

    We also asked them which features were most important to them. A survey, completed in November and December 2021, supplemented the information gathered during the tests. All six participants highlighted easy access to search history, the ability to manually browse the map, and the lane assistant. Five highlighted quick audio controls, and four mentioned voice search.

    As these were the preferences of a small group, we considered them alongside the observations from the sessions.

    What needed refining

    Adding a petrol station to the route turned out to be one step too many. Participants expected that simply selecting it would be enough to add a stop. It was also not always clear whether the petrol station had already been added to the route.

    Audio controls also required attention. Some labels were ambiguous, and participants wanted the interface to automatically return to the map after changing a setting.

    Another issue was the map being obscured. The search and alert panels took up too much space, and some of the hidden buttons were difficult to find.

    Not everyone wanted to use the app in the same way, either. For several participants, voice search was essential, whilst one person preferred to type in queries and stated that they did not use voice commands. We had to cater for both methods of use.

    What the research revealed

    The first stage enabled us to identify the problems drivers were already facing. Testing our own prototype then revealed where similar difficulties might arise in our design.

    On this basis, specific recommendations were drawn up: simplifying the process of adding stops, providing clearer confirmations, refining the audio control labels, and keeping a larger portion of the map visible. The research also provided further arguments for prioritising voice search.

    For me, the most important thing was linking what drivers said with what they actually did — first in their cars, and later whilst using our prototype.
  • App

    New look

    This project was quite unique, and at first it worried me a lot.

    We had very little time and a lot of issues to address. 

    Subject: 

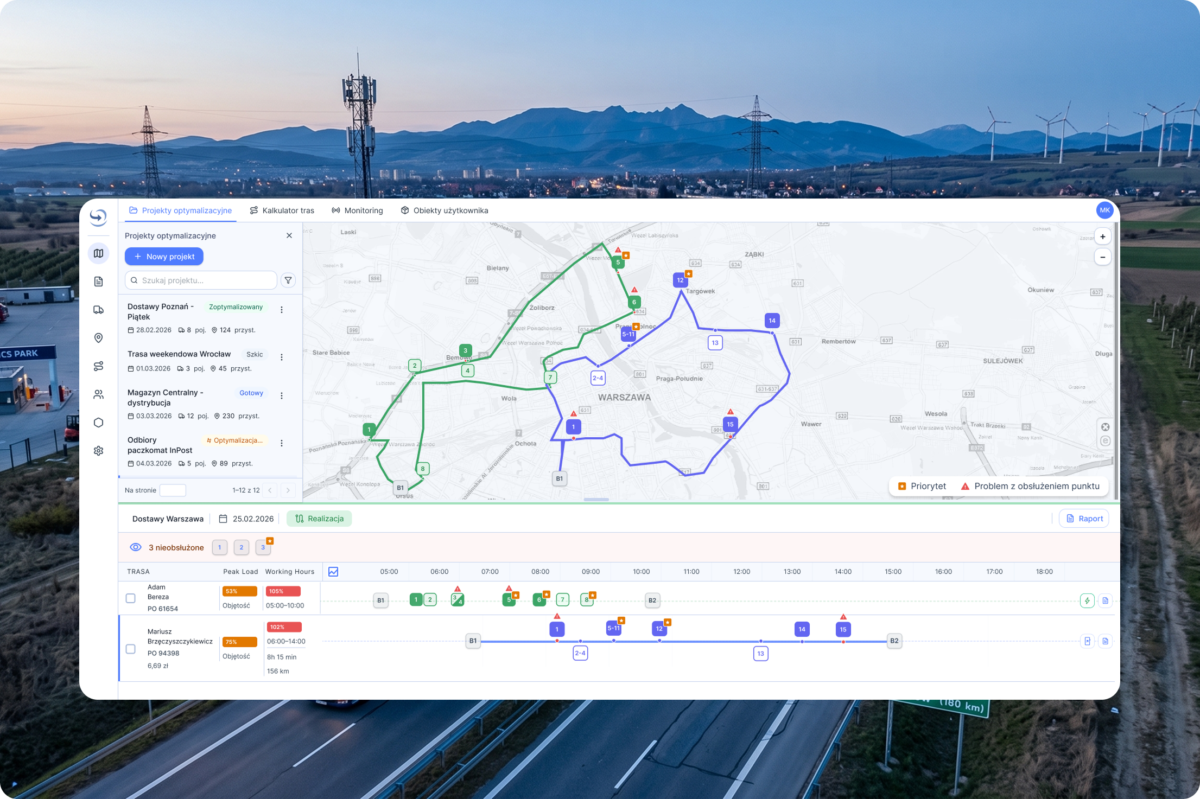
    A system for optimizing travel time and routes mainly for heavy-duty transport. The app had been on the market for quite some time and had a loyal customer base—mainly medium-sized businesses. However, our company wanted to bring it to a broader market, so it had to be attractive, easy to use, and compliant with the EAA—the European Accessibility Act. My task was to help with that.

    Starting point

    The entire application was recently rewritten in Vue. However, the user interface had not been refined. Every button and every form looked almost exactly the same as they did many years ago, when the application was first launched. The problem was that it did not meet EAA standards and was simply difficult to use. The brilliance of the engine on which it was based had no chance to shine. 

    The original plan was to address the main issues related to the user interface and user experience, since we only had one month to work with. However, as the backlog kept growing, we realized we wouldn’t be able to pull it off. Fixing all the issues would have taken us a month, and the end result would have been far from ideal. We would have ended up with the same looking interface, just slightly enhanced. 

    A New Approach.

    All right, so we got together again and decided that we needed a completely new design system and light, friendly and professional user interface.

    Technology Strategy: PrimeVue Aura + Tailwind + Figma Make + Figma Design 

    In this project, we used the PrimeVue library with the Aura theme and the Lucide icon set. This decision  allowed us to significantly reduce development time through the use of ready-made, tested components. The components were designed in accordance with accessibility standards, which eliminates basic errors. Modularity: we treated the library as a set of ready-made elements from which we build the final solution. Rapid prototyping and deployment were our priorities. 

    Parameters specific to our project overwrites Aura theme :

    • typography (size scale),
    • family font,
    • spacing,
    • rounding,
    • colors

    This allowed us to focus on the user experience, since many time-consuming issues were resolved for us.

    Process on paper: 

    Phase 0: Use Figma Design and Make to create a design system and prototypes, and test the user flow.

    User interviews: Identify the main user pain points and concerns.

    Phase 1: Rapid iterations and bug fixes.

    We replace the current components with components from the PrimeVue library. The goal was to quickly demonstrate results and eliminate UX and accessibility issues all at once.

    Phase 2: UX optimization.

    Implementing potential improvements to the user flow and optimizing features based on collected feedback.

    Phase 3: Redesigning the optimization schedule, as this was a key feature and the place where users spent the most time. It was designed last because it was the most complex view, so I needed the most time to design it, and the team – to implement it. 

    Main user painpoints:

    • Lack of clear system feedback and unintuitive workflows (UX Dead Ends). At key moments, the user faces a lack of transparency—from hidden limitations (e.g., the need to manually switch the view to 1,000 records to perform a bulk action), unlabeled icons, uncertainty about whether the system has saved the state or whether it’s safe to exit the view. On top of that, errors—crashes—that disrupt the workflow.
    • Data friction and cumbersome back-and-forth between systems (Excel vs. the application): Poor support for “dirty data” and geocoding forces users to constantly switch between the system and external tools (Excel, Google Maps). Manually searching for ZIP codes, correcting headers in CSV files, and the lack of system prompts for unrecognized locations create unnecessary frustration.
    • The algorithm’s “black box” nature and lack of control over optimization: Automatic route planning often operates in a way that is incomprehensible to the user (e.g., connecting absurdly distant locations or skipping stops “along the way”). The lack of insight into the algorithm’s logic leads to a decline in trust in the system’s recommendations, forcing the operator to artificially “trick” the algorithm (manually changing times, adding additional restrictions).

    Solution

    • To address the issue of unclear statuses and gaps in feedback (UX Dead Ends):
      We introduced clear system statuses, progress messages (e.g., during import/export), and clear labels for icons. Instead of hidden restrictions (such as manually changing list views), we simplified bulk actions into intuitive toggles directly within the interface.
    • Regarding the issue of data friction and jumping back and forth to Excel:
      We built data validation and hint mechanisms directly into the application, which reduced the need to manually correct CSV files or search for coordinates and ZIP codes externally in Google Maps.
    • We increased the transparency of the system’s recommendations (so-called “explainable logic”). We added a clearer overview of driver workloads and a visualization of constraints, giving users quick, intuitive tools to adjust routes without having to “trick” the algorithm.

    I don’t recall the handoff process ever going so smoothly and easily. I prepared all the screens in Figma Design and shared them via MCP. After the project was implemented, we ran tests, and I provided the developers with feedback on spacing, typography, and design consistency. 

    It took us a little longer, but the end result was very satisfying. I really appreciate the time we spent analyzing the problem, because those few workshops saved us from making a huge and costly mistake – attempting a month-long patch on legacy UI components that would have consumed our timeline without solving root usability issues or achieving legal EAA compliance. 

  • App

    Gamification of Safety (LINK4 x NaviExpert)

    The challenge:

    To design an in-app ecosystem that motivates drivers to drive safely through leaderboards and rewards, whilst achieving business objectives via seamless cross-selling (home, family and travel insurance) and partner offers.

    Transparency as the foundation of UX

    Before a user engages in the competition and enters an activation code, they must feel secure. The most important design element here was building trust through information architecture.

    The core of the experience: Telematics and Education

    The interface must communicate success or areas for improvement in a fraction of a second to support economical and safe driving.

    Balancing user and business needs

    The challenge was to design the views so that rankings and rewards (e.g. quarterly competitions) were not overshadowed by tiles promoting other insurance policies and partners, whilst maintaining the interface’s consistency.

  • Accessibility

    The European Accessibility Act and B2B systems

    In the IT industry—and especially when it comes to advanced B2B systems—there’s still a myth that digital accessibility doesn’t apply to professionals. As a UX researcher with many years of experience, I know this is a mistake. Let’s imagine a very likely scenario: our fleet manager, Steve, is working late because he’s swamped with responsibilities. He’s tired, probably a little irritated, and his eyes are strained after a full day in front of the screen. We want to make it easier for him to complete his task. Our system must provide him with clear messages, well-designed forms, and fonts of an appropriate size with good contrast to support him in his work. When we imagine this situation, it becomes much easier for us to empathize with the user and acknowledge that accessibility guidelines are simply necessary. The training on the European Accessibility Act helped us organize the technical knowledge needed to effectively implement these principles.

    For us, digital accessibility is not only an obligation, but above all, the foundation of responsible development of useful technologies. At some point in our lives, each of us experiences at least a temporary disability or injury. But it’s also a matter of the context of use. A fleet manager, for example, while using our service, is often answering phone calls, replying to emails, and arranging roadside assistance for one of their drivers all at the same time. They can’t devote 100 percent of their attention to the app. He doesn’t have time to figure out the nuances and intricacies of our system. Technology is meant to help him, not hinder him. So I consider accessibility as an organic, human experience.

    As Wojtek Kutyła, an expert in this field, points out, while usability design itself is often based on common sense, digital accessibility requires the addition of solid technical knowledge—empathy alone isn’t enough here; you need to know how to fix the code. A single poor design decision can completely prevent someone from completing a task or simply ruin their day. Obvious mistakes are unforgivable today. The main benefit is that our systems are becoming safer and do not exclude any users. The internet won’t fix itself, which is why we take full responsibility for making these improvements within our products.

    In solutions for drivers, such as NaviExpert app, we prioritized voice control, high contrast, and voice prompts. In traffic conditions, these are simply safety issues. Although interactive maps themselves are subject to certain exemptions under the regulations, the other elements of our systems are not.

    That is why we are adapting our fleet dashboards, login processes, and services to AA-level accessibility standards. Among other things, we are introducing the ability to navigate entirely via the keyboard, optimizing contrast, and ensuring clear and understandable error messages in forms, while eliminating incomprehensible technical jargon.

    Wojtek Kutyła provides some very insightful context there. He notes that we’re surrounded by reasonably good digital solutions in our daily lives, so when designing UX, that “common sense” is often enough to keep us from making any catastrophic mistakes. You can learn the basics of UX relatively quickly—you’ll get familiar with the user journey map, learn how to click around in Figma, and you’ll be able to deliver a project as such.

    It doesn’t work that way with accessibility, though, because it’s extremely interdisciplinary. Kutyła emphasizes that if an interface doesn’t work for someone using, say, a screen reader, empathy alone won’t fix it. You have to “figure out” why it doesn’t work technically, and that requires a combination of behavioral science, visual design, and often knowledge of code optimization or even the backend. This confrontation with such technical complexity can be quite shocking and intimidating for organizations at first.

  • UX Research and UX Design

    Transport sector – field research

    We had a major task ahead of us – we had to carry out research into the transport sector. It was quite an extensive study, as it was cross-sectional in nature: it covered drivers, small transport firms and larger logistics companies, as well as independent specialists.

    We began by conducting in-depth interviews (IDIs) with drivers. I didn’t want to use an agency, so we hit the road. We went round car parks and asked drivers if they’d be willing to be interviewed. They were usually very friendly and, surprisingly, keen to talk.

    Target groups – drivers

    Goal

    • Defining the key features of lorry navigation.
    • Identifying the problems drivers face that are not addressed by existing solutions

    My role

    I collaborated with the product owner on the research by conducting interviews with drivers and an industry expert, facilitating discussions with transportation companies, and analyzing the results. I also reviewed online driver discussions and product reviews to identify recurring issues and needs, and prepared a presentation of my interview findings.

    Survey categories:

    • Experienced long-haul drivers (5 people) – driving mainly on fixed international routes.
    • Experienced local driver (1 person) – operating within the region (Wielkopolska/Poznań) on regular routes.
    • Owner of a small haulage company (1 person) – managing a fleet of ~15 vehicles on a variety of routes both domestically and abroad.

    Conclusion

    Respondents
    Experienced long-haul drivers (5 people), mainly driving regular international routes.
    An experienced local driver (1 person) – covering the region (Wielkopolska/Poznań) on regular routes.

    The main conclusion was that the drivers still had  a lot of problems with finding the most important information about weight limits, bridge heights and road accessibility for heavy goods vehicles. This information is simply out of date or changes too quickly, given the number of roadworks in Poland. What’s more, it turned out that every country has its own specific issues when it comes to problems on the road.

    The second important issue was lorry parking areas. We had the opportunity to gather information about the specific needs of lorry drivers on the roads. In Europe, it is rare to find good parking areas with sufficient spaces and facilities such as a shop, showers or security. In fact, Poland has some of the best facilities of this kind.

    One of the most important observations was that, in reality, they do not rely heavily on navigation apps. Quite the opposite, in fact. They usually rely on their own experience and knowledge that is difficult to convey, such as intuition or expertise in specific areas.

    Target group – transport companies

    • Characteristics: large-sized transport company
    • Routes and coverage: different routes every day, international
    • Staff profile: a stable workforce

    Characteristics: 

    • The order of stops is often dictated by the customer, but the driver may suggest a change if they see a better solution.
    • Drivers’ knowledge and experience are highly valued – their suggestions regarding routes, the order of loads or detours are often taken into account.
    • Fixed routes are only used for high-value cargo, in accordance with customer requirements

    During the interview, a great deal of interesting information came to light, along with a number of challenges. It turned out that, despite a highly advanced system, there are still problems with communication with drivers. The quickest way is always a phone call, but information and changes to routes and schedules remain outside the system. Some drivers prefer to send messages via text or various messaging apps. Before long, information is circulating through various channels and it becomes difficult to keep track of it.

    Another issue is that so many factors arise during the course of the day that 50 per cent of the original plan ends up changing. No system is capable of coping with this – only highly qualified staff who are able to handle dozens of orders at the same time.

    Interview with an expert

    Finally, we had the opportunity to speak to an expert in this field. His vast knowledge allowed us to look at the issue from a broader perspective. We are currently going through a period of transformation, and the industry is facing many challenges. First, we need to work out how to tackle the shortage of drivers and how to maintain the competitiveness of services.

    As part of the research, we analyzed whether we should develop a standalone navigation app for trucks to complement our existing navigation product designed for passenger cars.

    Among the drivers we interviewed, a recurring theme was that the navigation system tended to support their own judgment rather than dictate their decisions. They already had tools they relied on and pointed out the limitations of navigation apps, which did not always reflect actual road conditions. The research findings did not support the development of yet another fully functional navigation app.

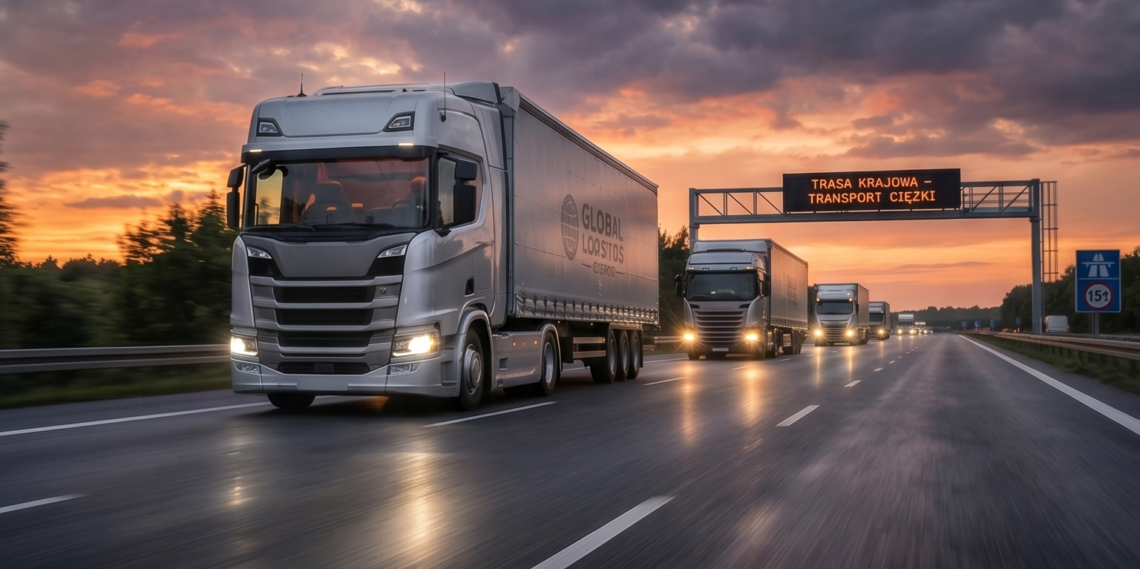
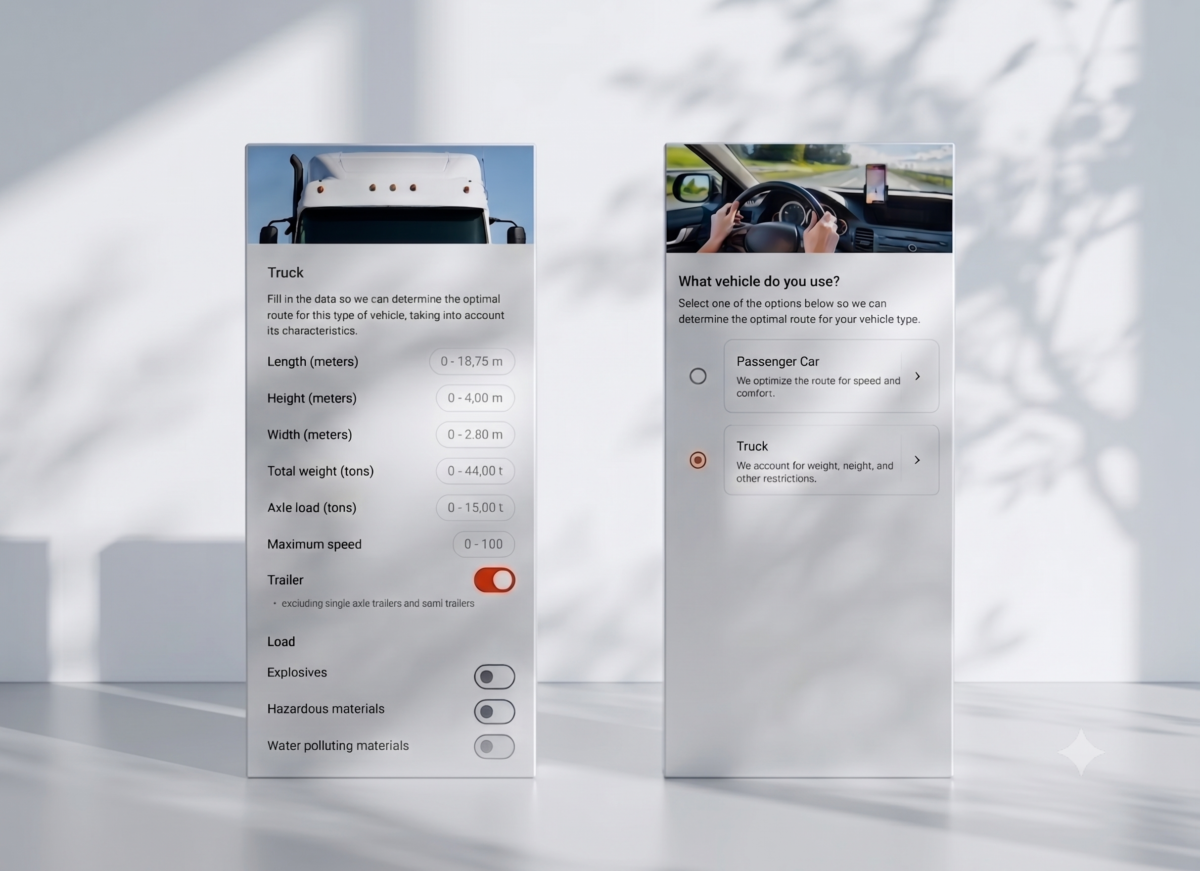
    The research helped redirect the product strategy toward adding a truck profile, vehicle parameters, and truck-specific limitations to the existing app. It also influenced the direction of development for a broader transportation management system (TMS).

    Another opportunity to explore was an AI-based voice assistant: one that helps drivers find parking spots and destinations while minimizing the need to interact with the screen.

  • App - UI

    UI & visual id

    Naviexpert Telematics

    Naviexpert Telematics is a powerful tool for fleet managers for tracking savings in the fleet.

    My task was to create a visual identity for the product, design a computer service for fleet managers and a mobile application for drivers. I had a lot of useful materials at my disposal, such as source research, workshop materials and video recordings of interviews with users. I had a good idea of what was needed, but I still had a lot of work ahead of me, such as creating mock-ups, designing user flow and refining many small details.

  • App - UX Research and UX Design

    Case study – redesign. A whole new story

    The application I was asked to redesign is a car navigation for mobile devices – Naviexpert

    Current situation

    • A strong representation of hardcore users who have been using the app for years
    • Very mature interface
    • Declining rate of new users
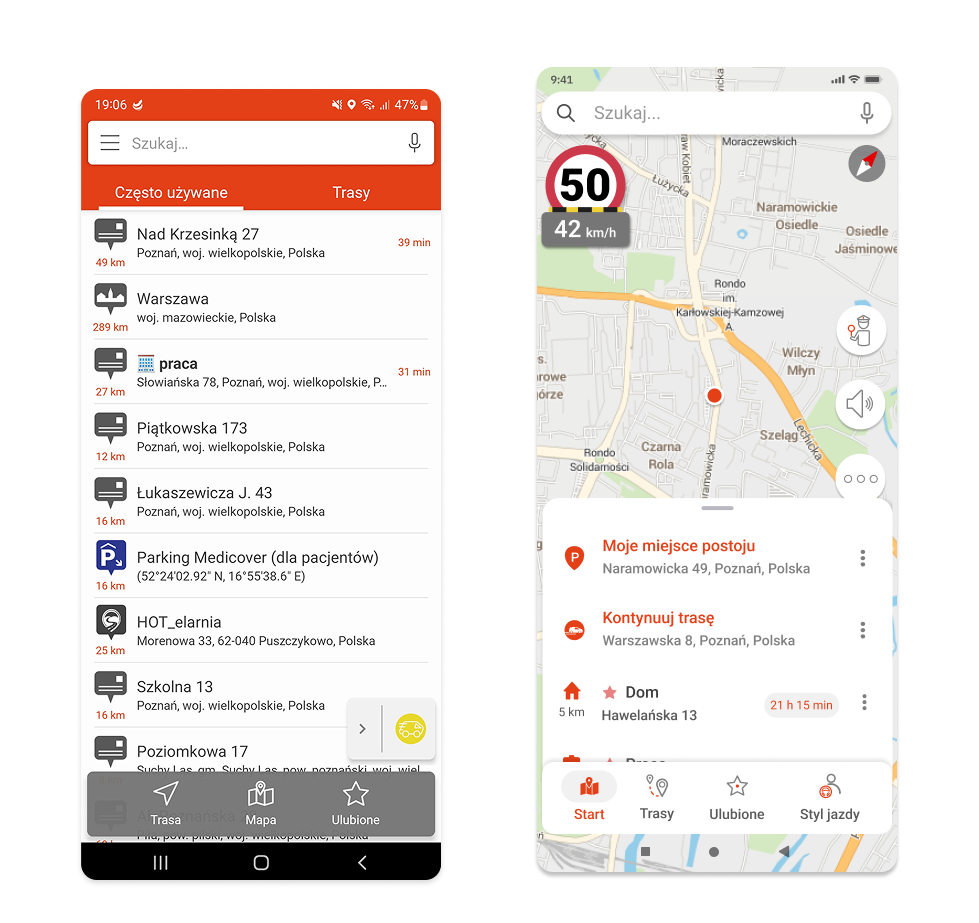
    • Interface somewhat outdated

    Diagnosis

    • New standards on the market with similar applications
    • Many advanced functionalities with minimal practical usage

    Objectives

    • Attract new users
    • Keep our user base
    • Revamp the design

    Steps

    • Analyse data to detect rarely used features
    • Select most important features
    • User testing
    • Transition to the new technology as painlessly as possible, without neglecting the development of the application and the needs of the B2B customers.

    Challenges

    One of the primary challenges for long-standing mature products is to maintain consistent visual identity.With the continuous addition of new features, the product keeps evolving, becoming overly complex and harder to navigate.  Ultimately, the application as it stands no longer supports optimal user interaction, prompting a redesign.

    Data analysis

    The initial step involved analyzing data and usage statistics. While we had a clear understanding of the core features in our product, there was some uncertainty around very specific and advanced options. Investing in features with minimal user engagement seemed pointless. Conversely, we identified key functionalities that separated us from the competition, with the hope of creating a more coherent product.

    Research design

    Our main concern was to keep our regular, hardcore users happy. We knew that a large portion of our loyal user base relies heavily on the most advanced options. Their feedback was crucial to us, which is why we invited them to participate in our research. We also considered new users whose expectations are primed by major players on the market.

    Methodology

    • Usability testing
    • RITE (Rapid Iterative Testing and Evaluation)
    • Survey methods
    • IDIs  (in-depth interviews)
    • Clickable hi-fi mock-ups

    Design objectives

    • Cater to the needs of users accustomed to products from major competitors
    • Ensure redesigns maintain continuity for existing loyal users
    • New UI should reflect our key differentiators

    Respondents

    • Regular users, 8 people
    • 35-65+ years old
    • Mostly men 
    • Core product users

    New users

    • 8 people, unfamiliar with the product
    • 25-40+ years old
    • Women and men
    • Mainstream navigation users

    Approach

    • Stationary user testing
    • Duration of the examination: approx. 1 hour
    • Recorded session: camera + screen recording with sound

    Results

    Speaking with our users made it clear that we need to proceed with caution. Preserving the features that make our product stand out is essential. In other words: evolution, not revolution. While respondents were generally happy with the new design, some long-time users expressed hesitation about the changes projected. By contrast, placed greater emphasis on speed and responsiveness. 

    Ultimately, the research proved critical in guiding our design choices. Starting development without this data would have been like trying to navigate a foggy forest with only a faint hope of getting anywhere.

    User testing

    Design

    Design system, specification, flow and information architecture.

    With the data in hand, we moved on to the next phase. While the main objectives were already clear, we still faced thousands of minor inconsistencies, flow issues, and edge cases that needed to be addressed.

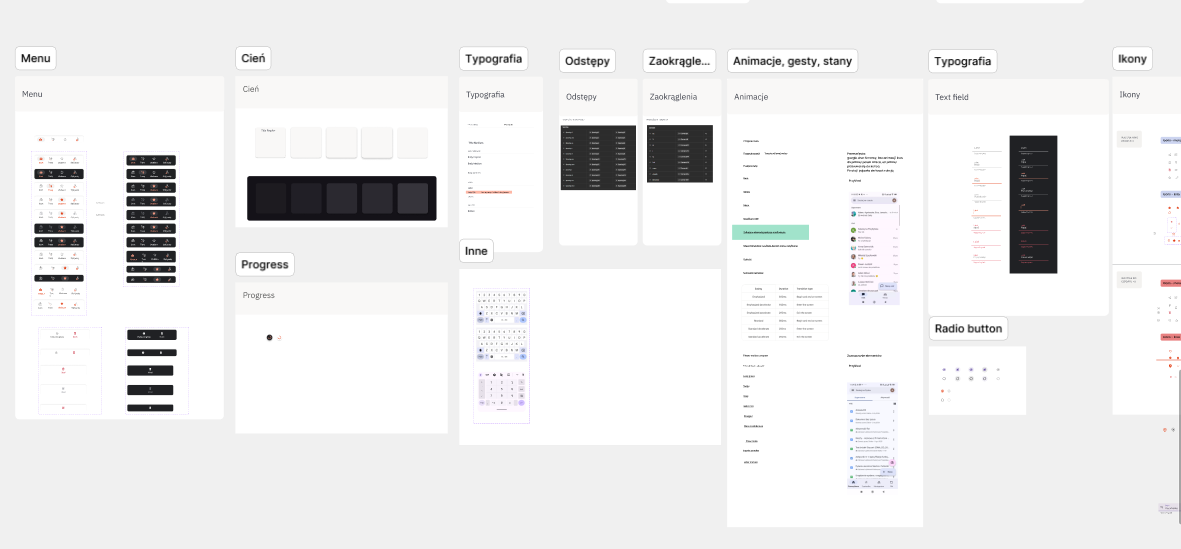
    An entire design system was developed, including

    • typographic principles
    • colours
    • components
    • icons
    • micro-animations
    • flows
    • text fields with all states (inactive, active, validation)
    • buttons
    • night and day mode
    • vertical and horizontal view
    • extremely small screens, non-standard font size settings
    • reference resolutions

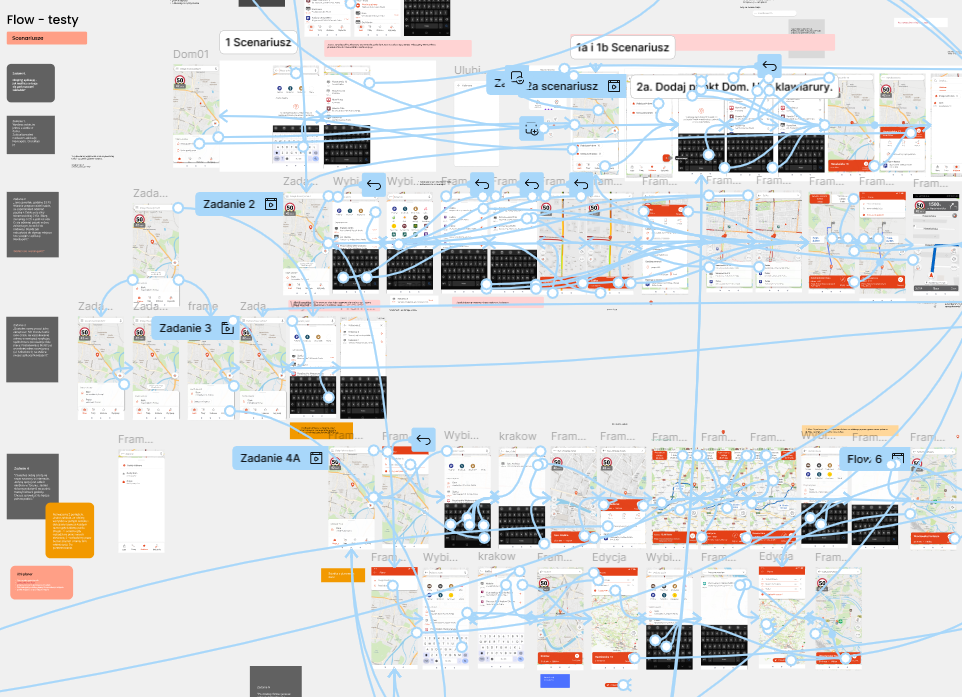
    Design, iterations is always a long process, sometimes messy too

    We also meticulously documented everything in Confluence, complete with links to Figma mock-ups. Eventually, we transitioned fully to Figma, using the specifications embedded in individual Jira tasks as our single source of truth.

    Every element had to be precisely measured and clearly described to minimize ambiguity during handoff. Still, despite our best efforts, uncertainties and unforeseen scenarios inevitably arose. We worked back and forth with the development team, continually revisiting preestablished paths and refining them through further consultation.

    Our main goal was to introduce the map view as the main screen.

    Internal tests

    The first recipients were our own employees, who provided detailed and valuable feedback. We immediately added some of their suggestions to the backlog as actionable tasks, while deciding to leave out others.

    Beta testing

    Following the above, we moved into the beta testing phase, sharing a test version with our beta users and inviting their feedback. The responses received were both insightful and encouraging, with several users even offering their own ideas and solutions, which proved especially valuable.

    Next steps

    Our next step was to survey a broader spectrum of our users for their impressions of the changes. This is one of the most critical phases in the entire process, as it helps us identify the elements that still need attention and prioritization, while also determining those to be addressed later. The survey results were positive: users expressed overall satisfaction, and we were able to collect targeted feedback on areas where we had lingering doubts

    To sum up

    Redesign is a long and complex process that involves balancing many factors—and there’s always a risk it won’t be well received. Fortunately, that wasn’t the case here. In my view, the most important factors throughout the process included:

    • Clear goals and product vision
    • Thoughtful prioritization. We can’t build everything, but we can excel in the key features/where it matters most.
    • Data-driven design. It may seem obvious, but it’s critical to understand both the strengths and weaknesses of the product.
    • Effective communication. Get the developers and testers involved early into the design process.
    • Robust design system to ensure seamless handovers.
    • Thorough testing and iterations. From major features down to the smallest details, test everything appropriately based on context and budget.

  • UX Research and UX Design

    Case study – women behind the wheel. Target group research

    The main users of the Naviexpert app are men aged 40 or above, accounting for more than 80% of all users. However, we wanted to gain deeper insights into our female users. What kind of drivers are they? Do they use the app daily or only during holidays?  How do they spend their free time?

    Survey

    To better understand this user group, we decided to combine several research methods, starting with a survey. We distributed a questionnaire to gather insights into their driving behaviors and habits, including how often they drive and how they perceive themselves as drivers. Do they consider themselves skilled, attentive, confident, or experienced?

    From the hundreds of respondents, we selected twelve and invited them to IDIs (in-depth interviews). 

    The interview was structured into several parts. The first focused on habits and behaviors – we aimed to understand when and in what context users rely on our navigation app. Do they use it daily or primarily for travel? Do they use it alongside other apps or independently?The second part was a practical exercise designed to explore the perception of our brand. The final section delved into participants’ opinions and perceptions, spanning topics such as road culture, stereotypes, and personal beliefs. Each interview lasted approximately 45 minutes and was conducted in a relaxed, conversational format with open-ended questions. Moderation was kept to a minimum to encourage natural responses.

    Conclusions

    The conversations/interviews exceeded our expectations. We met fantastic, inspiring, and confident women who embrace challenges, enjoy driving, and associate using the navigation app with a sense of freedom and independence. Their insights made us realize that we not only want to tailor the product more closely to the needs of our female users, but also foster a supportive and empowering community around them.

    Sorting cards exercise – brand identity

  • App - UI - UX Research and UX Design

    Case study – Driving style

    The project is a fleet management telematics platform. It features a desktop application for the fleet manager and an app for drivers. Among other services, the platform offers an algorithm that analyzes the driving style

    Business objective

    To expand the offering, promote fleet safety awareness, and advance interest in driving styles.

    Design objective

    To encourage drivers to install the app, increase user engagement, and raise safety awareness. Benefits for the fleet as a whole include increased fleet safety, along with reduced damage and operating costs.

    Desk research

    Analyses of our metrics and discussions with fleets have revealed that the driving style feature is not very popular. While fleet drivers are aware of this functionality, they tend to overlook it in their day-to-day work. Our goal was to change that.

    IDI interviews

    In the course of the project, we conducted six interviews with our clients. The aim of the research was to uncover the crucial issues and pain points in terms of fleet claims and the attendant costs. We sought to establish how they monitor fleet fuel consumption, whether they encourage drivers to drive safely, and what their policy is on eco-driving.

    Methodology

    In-depth interviews (IDIs)

    Time: 1-1.5 h

    On-line interview

    Respondents: our core users

    The research findings offered us  a deeper understanding of the topic. We identified the major pain points for fleet managers, along with what they deal with on a daily basis and what consumes most of their time. With our solution, we aimed to unshoulder fleet managers from some of the responsibilities.

    Application

    We decided to design a new “Driving style” feature.

    We wanted for drivers to be aware of several aspects of their driving style, including:

    • safety
    • progress over time
    • How do they compare with other users of the system?

    Design

    After consulting with the team, we developed a series of wireframes to represent the new feature. 

    Usability Testing

    Methodology:

    • RITE
    • Benchmarking tests
    • Five-second test
    • 7-10 respondents per round

    Our initial approach focused on presenting all the data and metrics we had collected on the users’ driving styles (and the amount proved to be rather substantial).  The test results were very unflattering. The respondents lacked a clear understanding of the data presented and were unsure how to navigate the interface. The volume of information, in particular the numerous graphs and figures, was perceived as unclear and confusing.

    New design

    We decided to change our approach. Rather than presenting raw data, we aimed to tell a meaningful story about their respective driving styles, highlighting areas for improvement and/or more focused attention.. We gave them hints, simplified the interface, and added elements of playability to enhance user engagement. Our job is to analyse all of the data and offer personalised guidance, much like a real coach would.

    Second round of tests

    This time, the test results  were more promising. The story presented was much clearer, prompting important conclusions. The tone and voice of the guidance are crucial. Nobody wants to be chastised or lectured. Our goal is to lead by example and encourage change with a touch of humour. The guidance provided should be adequate and personalised.

    Third round of testing

    User feedback was generally positive.  The tips were clear and the idea of eco-driving was well understood. Participants navigated the interface with ease. However, some concerns emerged. Those using the app on a daily basis may not have sufficient time or patience to read all the guidelines. There were also challenges in promptly identifying the most critical information..

    Implementation

    After implementing our solution, we analysed the data, observing a strong click rate on launch day. Over the traffic experienced a slight decline.

    One year later…

    A year after launching the new feature, we asked fleet managers for feedback. Several reported reduced fleet costs, fewer claims,  and a gradual improvement in the driving style. The guidance provided has proven to be an effective way to improve the driving style. As a team, we are pleased with these positive outcomes.

  • App - UX Research and UX Design

    Case study – Dark mode design

    Objectives

    The main objective of this project was to create a night mode of an existing navigation application on the market.

    Current situation

    The application not only lacked a dark mode but also had no consistent color or style system within the codebase. Nearly every element used its own unique values, which led to several issues. The team lacked clear specifications and guidelines when designing new elements, and even minor changes proved to be time-consuming.

    Inventory

    The first step was to identify all the main screens and components to understand what was needed and establish a solid starting point. I then created a color scheme for the light mode, removing any unnecessary values along the way. We defined the naming system and assigned tokens, also developing the corresponding dark mode equivalents for every value. Once every element in the design system was linked to a token, we proceeded to assign the appropriate values for night mode.

    Tests

    We conducted the initial tests under “combat conditions,” i.e., in a parked car inside a garage, with the lights turned off. However, this setup proved insufficient. Reflections, high contrast levels, and even the phone’s automatic settings affected readability. It wasn’t until we conducted on-the-road tests that the actual visibility issues became apparent.

    Beta tests

    Before releasing the app to production, we gathered feedback from our beta testers, which revealed several areas with insufficient contrast.

    Conclusion

    If I were to approach this project again, I would make several key improvements. 

    First, we should have created a comprehensive snapshot of all the screens within the application. Given the app’s complexity, we focused only on a few key screens. While capturing the entire interface would have required significantly more time, it would have also provided us with a more robust foundation for the design process.

    Second, we should have conducted mock-up testing at the very beginning of the project. This would have helped us mitigate readability and contrast issues, in particular given the unique context of use, which presents a notable design challenge.

  • Illustration

    The golden wand

    This little booklet was based on Der Struwwelpeter, an original book by Heinrich Hoffmann from 1845. The project was created at the University of Fine Arts in Poznan as part of my graphic design faculty. This book is interesting for several reasons. Firstly, The Golden Wand is one of the earliest children’s books to combine visual and verbal narrative and is considered a precursor to the comic books. Secondly, the exceptionally intelligent and witty stories can be a real challenge for the illustrators. Each one is a rhythmic story with a clear moral that shows the unfortunate consequences of children’s disobedience. My take on the subject was to capture the essence of each story in a very minimalistic manner so they can funcion as a stand-alone posters. I studied the black and white areas intersecting each other, strong lines, and at the same same trying to play with form, double meaning of each image and hidden messages.[1]

    dyplom2

    dyplom1